
2023级硕士生刘俊杰的研究成果在Soil Biology & Biochemistry发表:揭示全球尺度上土壤呼吸对CO2浓度升高的响应

第一作者:刘俊杰(2023级硕士生)
通讯作者:段阿冰 副教授
论文DOI:https://doi.org/10.1016/j.soilbio.2025.109734
第一单位:湖南大学环境科学与工程学院
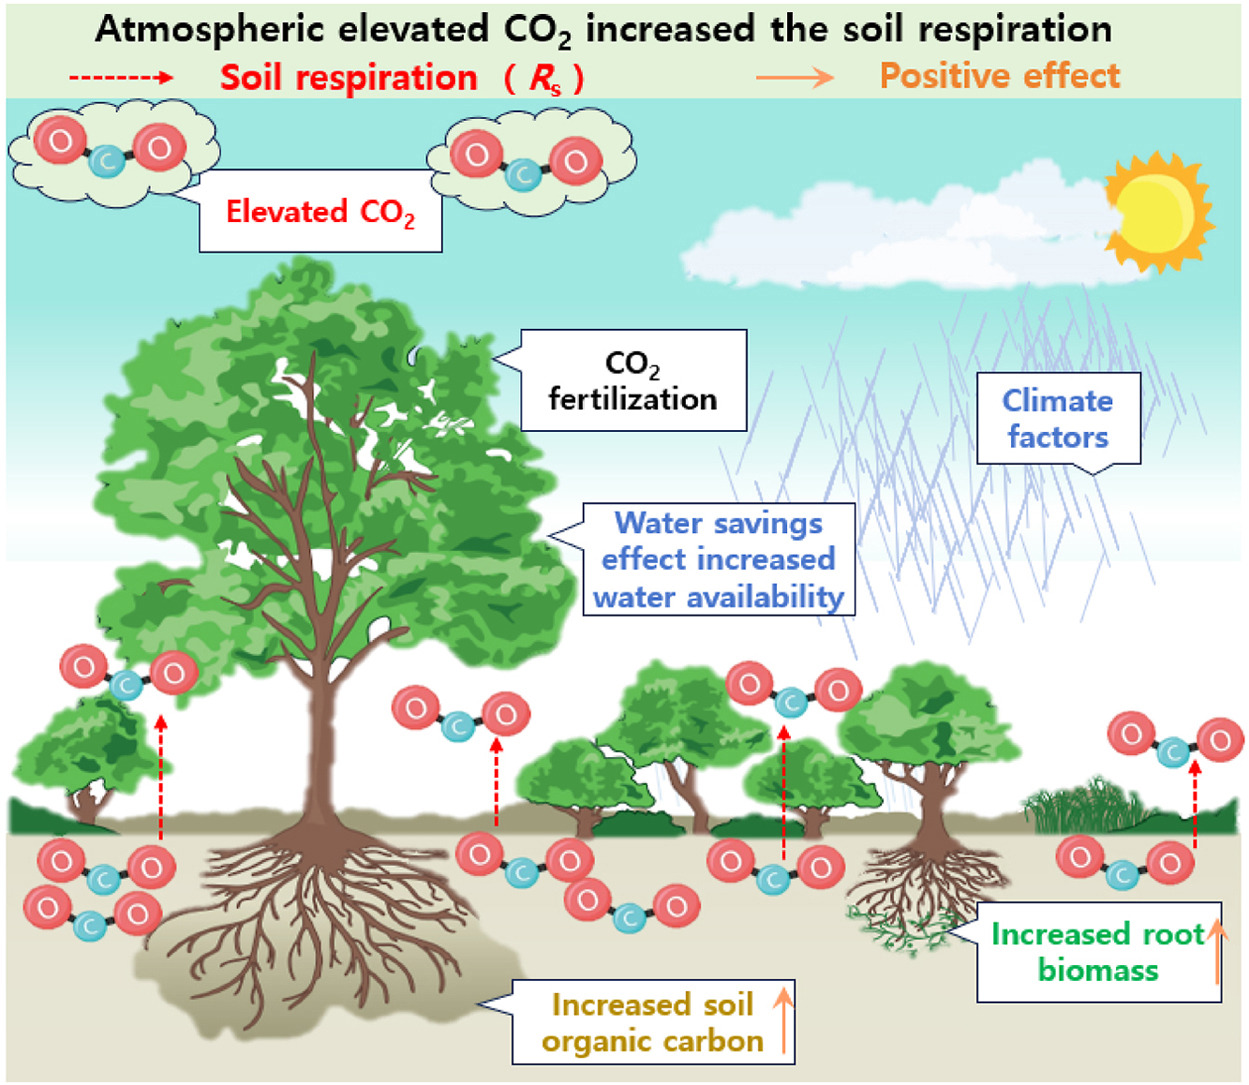
CO2浓度上升对Rs影响的理论可视化及其控制机制
成果简介
湖南大学环境科学与工程学院段阿冰课题组在Soil Biology & Biochemistry上发表了题为“A global meta-analysis of soil respiration in response to elevated CO2”的研究论文(DOI:10.1016/j.soilbio.2025.109734)。Soil Biology & Biochemistry是土壤领域认可度极高的顶级期刊,该期刊旨在以原创性的研究揭示土壤的生物过程、其对环境的影响及与植物的相互作用,以了解土壤生物学和生物化学在调节土壤功能、农业可持续性和生态系统服务中的作用。发表在该刊上的研究成果通常要求具有重大的理论突破或深刻的机制性阐释,极其注重研究的原创性、科学严谨性、实验设计的合理性以及结论的可靠性。期刊每月出版,采用严格的同行评审制度,确保所发表文章的学术质量和创新性,稿件接受率在15%左右。
这项研究提取了207项已发表的有关CO2浓度升高(eCO2)研究中的1191对观测数据,量化了eCO2对土壤呼吸(Rs)及其相关因素的影响。结果表明,eCO2对Rs的影响在不同生态系统和气候区域会有显著差异。首次提出,Rs对CO2升高持续时间的响应呈凸性关系。此外,通过机器学习中增强回归树(BRT)分析量化环境因子的贡献,并使用分段结构方程模型(piecewise SEM)进一步揭示环境因素通过哪些直接和间接途径影响Rs对的eCO2响应。总之,这项研究推进了我们对不同生态系统和气候区域中Rs对eCO2的响应的理解,并为提高土壤碳循环模型的准确性以及制定有效的气候变化政策提供了科学依据。
引言
Rs是陆地生态系统碳循环的核心环节,涉及土壤有机质微生物分解和根系代谢产生的CO2排放。作为大气与陆地间的重要碳交换通道,Rs的规模远超化石燃料排放。由于其敏感性,Rs的微小变动都可能显著影响大气CO2浓度,进而加剧全球变暖。随着工业革命以来人类活动的加剧,大气CO2浓度显著上升,这对Rs产生了深远影响。截至2023年,大气CO2浓度已比工业化前高出51%,达到419.3 ppm。因此,在当前气候变化加剧的背景下,深入探究eCO2对Rs的影响显得尤为关键。此前相关研究存在地理分布局限、实验方法差异大等问题,且未综合评估多因素对Rs的贡献,本研究旨在通过元分析填补这些空白,通过Google Scholar、Web of Science和CNKI上检索了截至2024年03月发表的相关文献,经筛选后得到了来自207项eCO2研究中的1191个观测数据对,编制了一个更全面的数据集,以量化Rs及其相关因子对的eCO2响应,并探讨这种影响在不同生态系统类型、气候区域以及eCO2幅度和持续时间上的差异。基于现有知识,研究提出了三个假设:(1)eCO2会增加根系生物量、土壤有机碳(SOC)和土壤含水量(SWC),从而刺激Rs;(2)Rs对eCO2的响应在不同生态系统类型和气候区域间存在差异;(3)环境变量,如eCO2的持续时间、植被类型和气候条件,会影响eCO2对Rs的作用。
图文导读
在本次荟萃分析中,研究地点的地理分布情况(n = 133)在下图直观呈现,其中圆形和正方形分别代表森林(n = 71)和草地(n = 62),黑色和红色分别代表湿润地区(n = 103)和干旱地区(n = 30)。
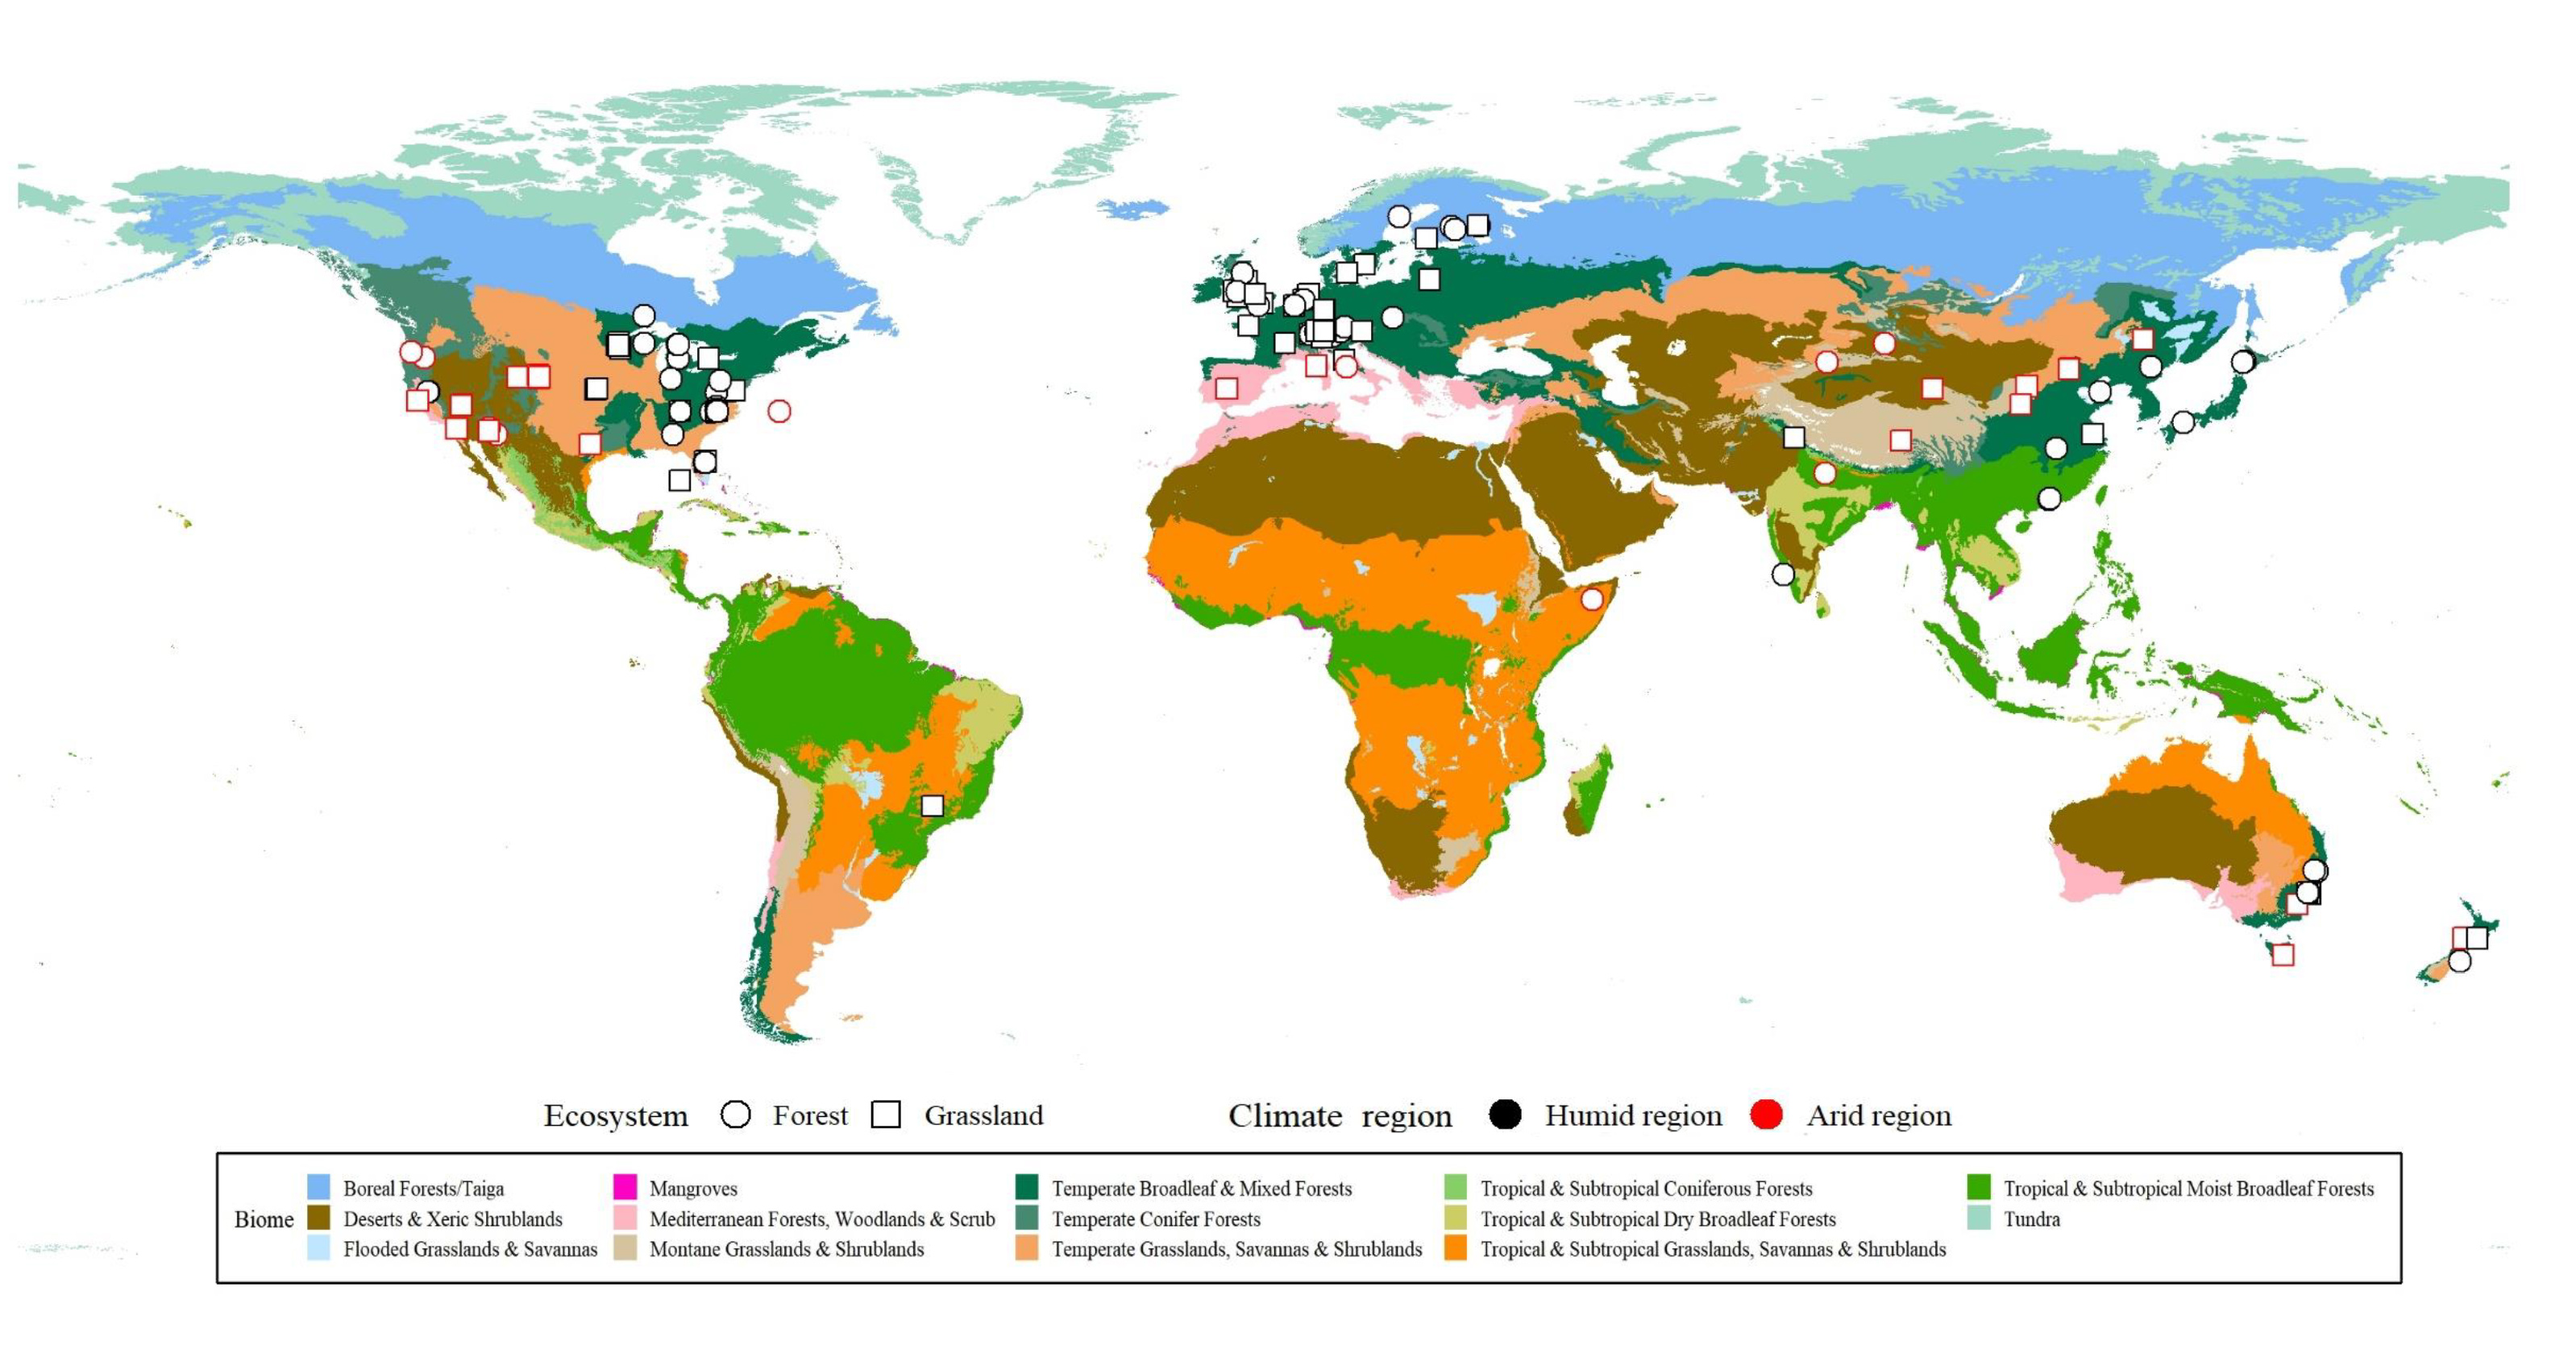
Fig. 1. Global distribution of study sites in the meta-analysis. The geographic distribution of the study sites (n = 133) in this meta-analysis is presented visually on thematic maps, with circles and squares representing forests (n = 71) and grasslands (n = 62), respectively, and black and red representing humid (n = 103) and arid regions (n = 30), respectively. The base map is based on Ecoregions2017©Resolve within 14 terrestrial biomes.
总体而言,Rs与eCO2的大小呈正相关。森林中的Rs对CO2的响应比草地中的更强且更迅速(Fig. S3a)。在湿润地区,Rs随着eCO2的强度增加而增加,而在干旱地区则呈现出相反的模式(Fig. S3b)。然而,Rs对 eCO2持续时间的响应呈现出一种凸性(convex)关系明当实验持续时间延长时,CO2对Rs的正效应可能会减弱。
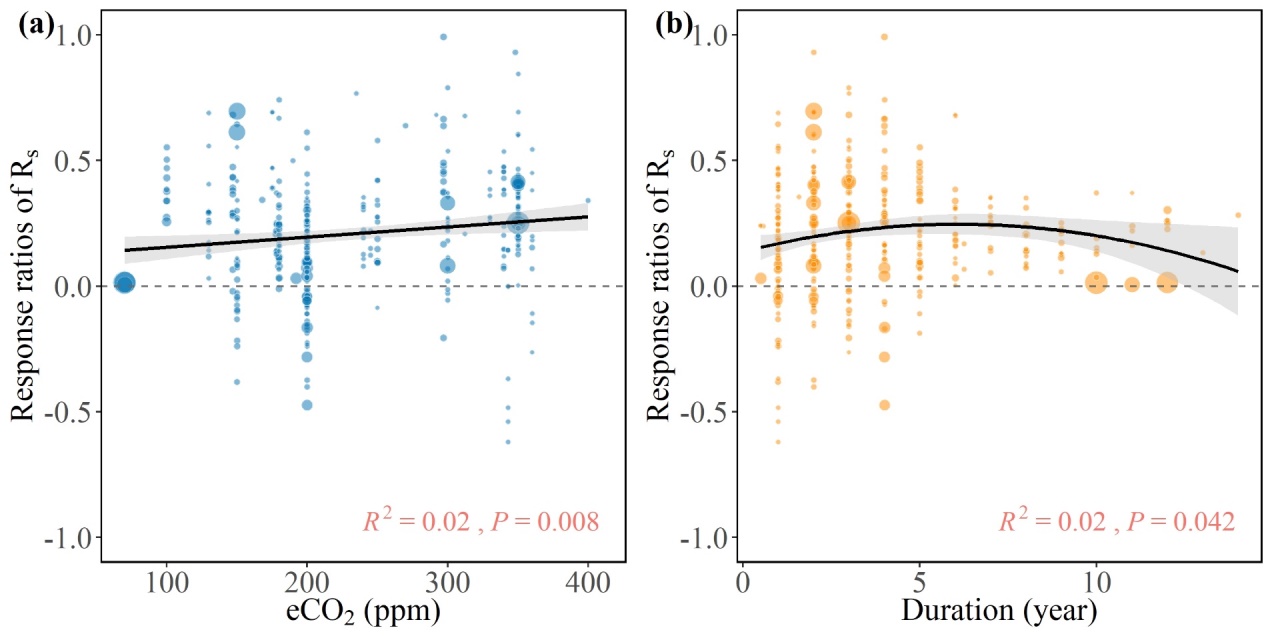
Fig. 2. Relationship between Rs and eCO2 magnitude (a), eCO2 duration (b). The size of the bubble is proportionate to the weight of the effect size (lnRR) in the random-effects meta-regression. The gray area around the regression line represents the 95% confidence interval.
eCO2显著增加了根系生物量(+32%)、土壤有机碳(+3.6%)和土壤含水量(+9.6%),导致Rs总体增加了23%,并且eCO2对Rs的影响在不同气候区域和生态系统类型之间存在显著差异。在eCO2处理下,湿润地区(26%)和森林生态系统(28%)的Rs增加幅度分别显著高于干旱地区(14%)和草原生态系统(15%)。同时,采用OTC方法时的Rs增加幅度(25%)高于FACE方法(19%)。
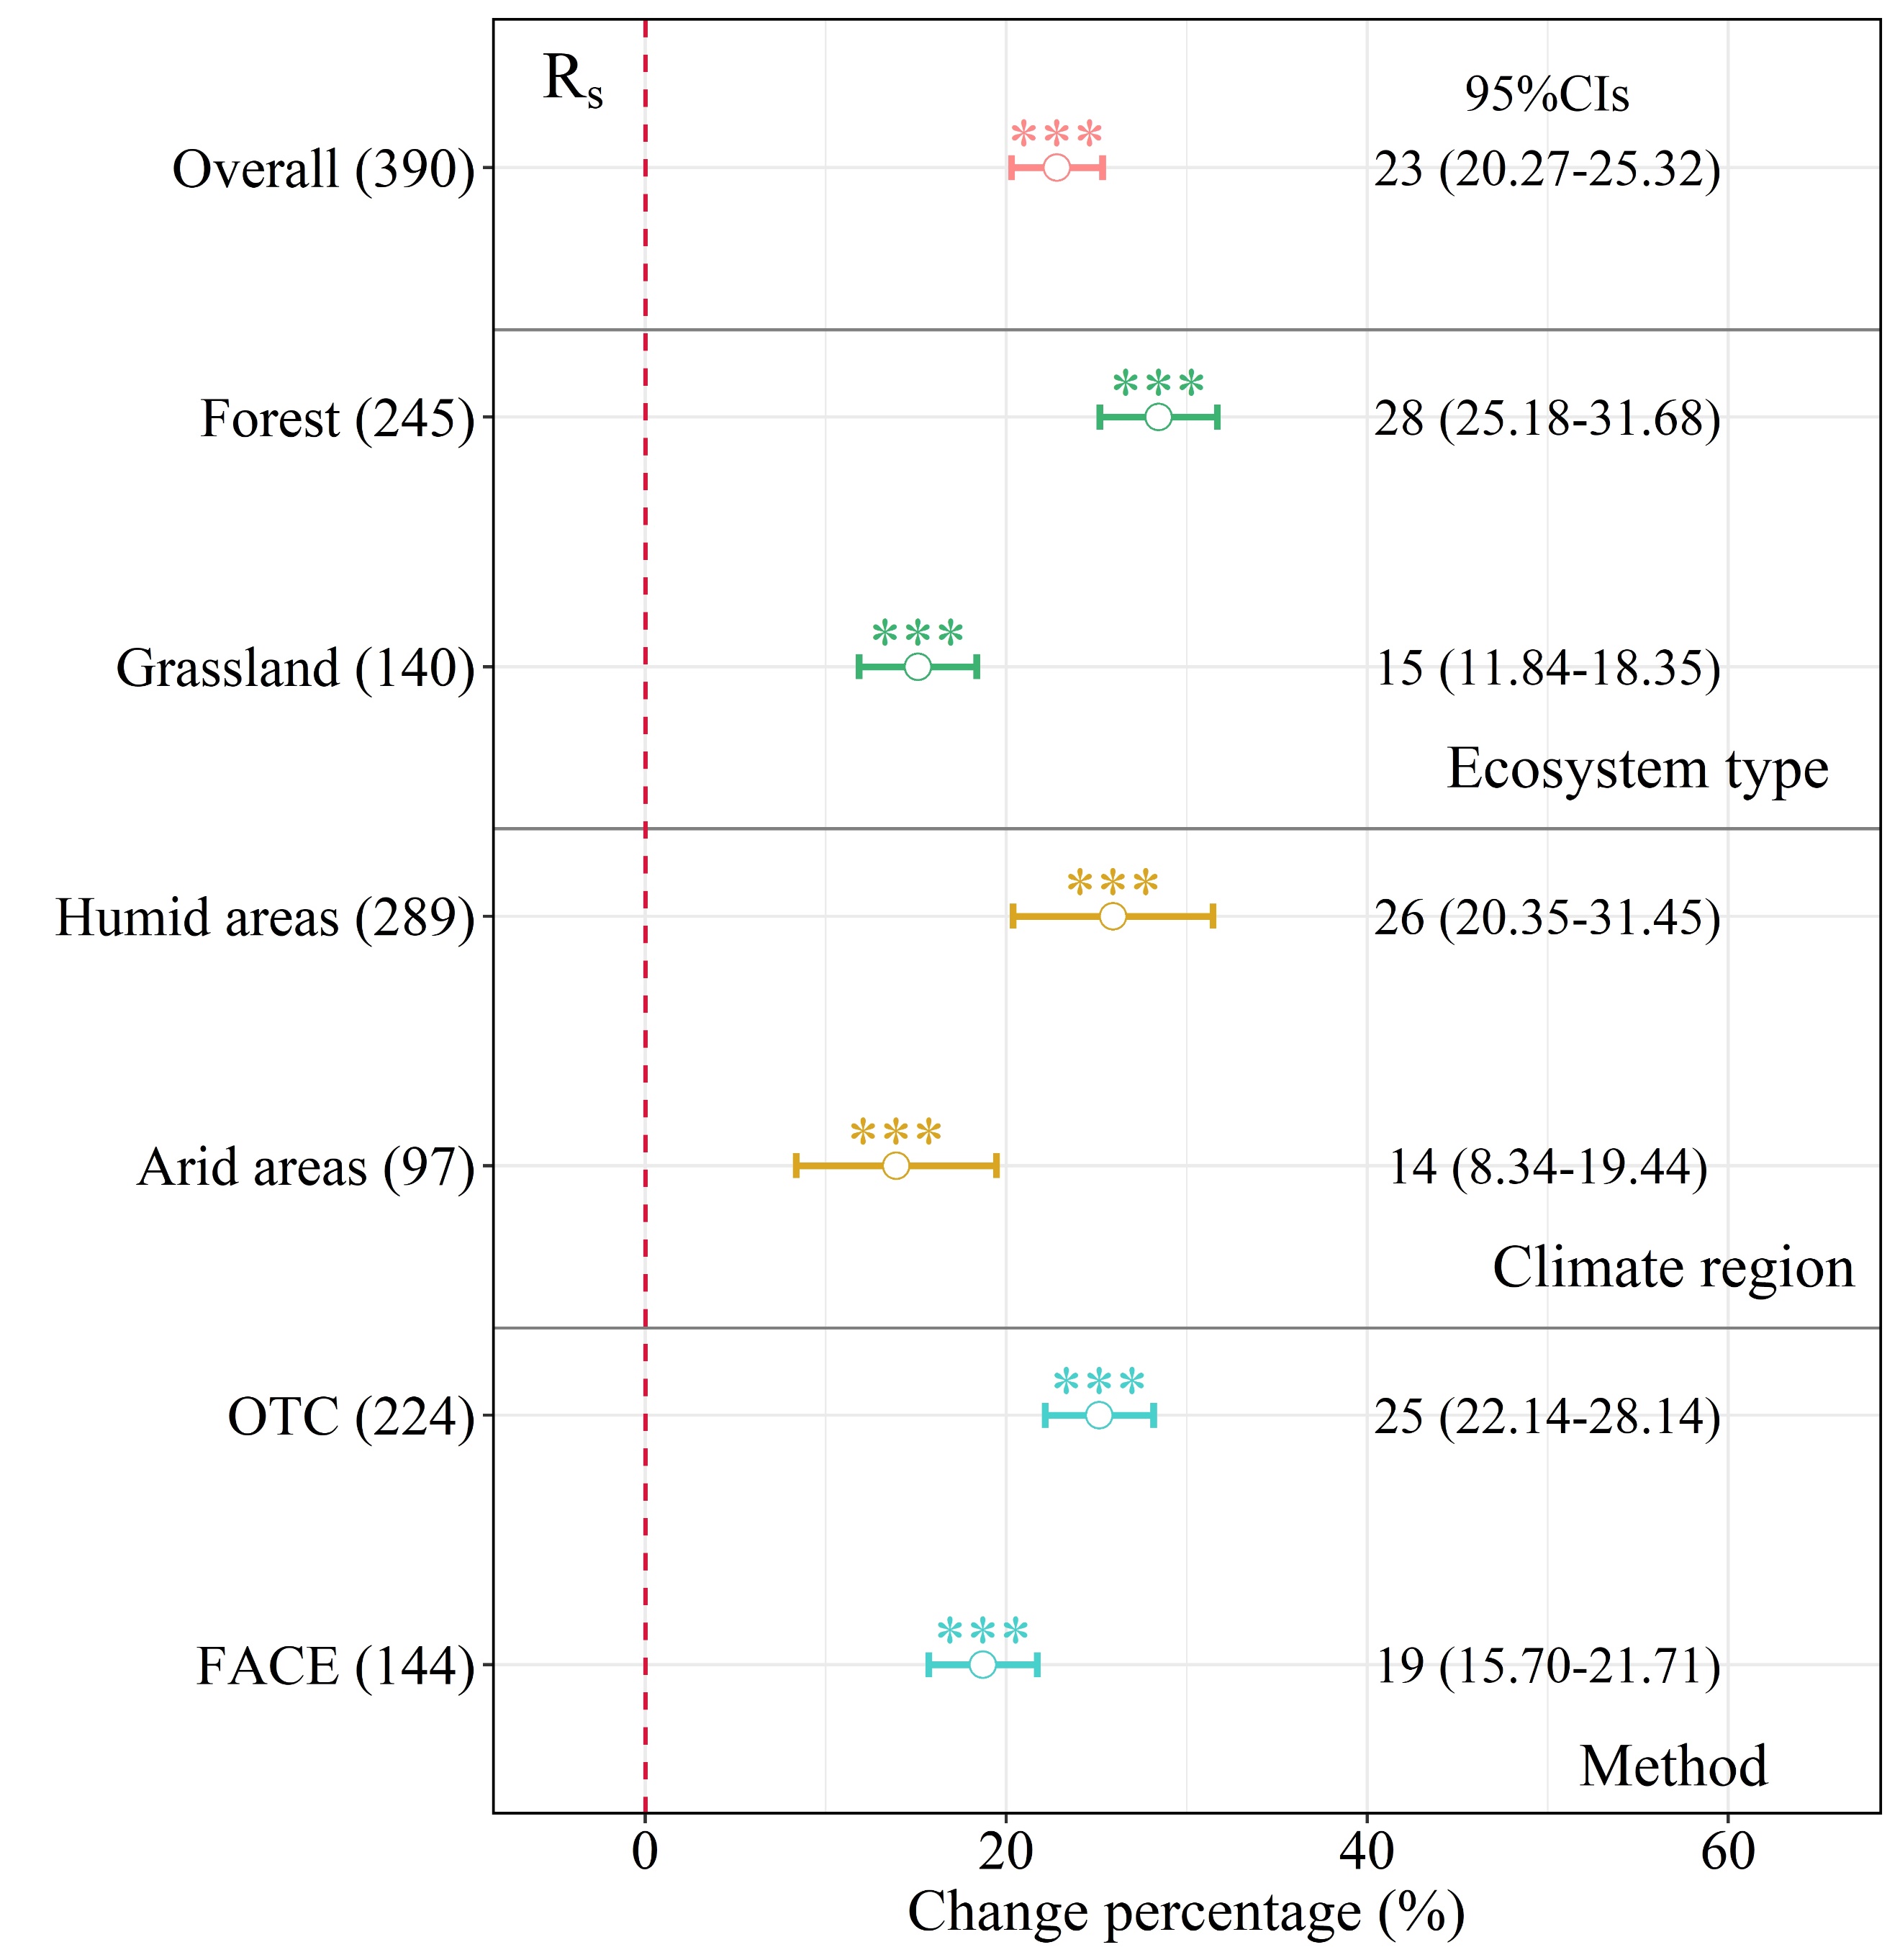
Fig. 3. The effect of eCO2 on Rs. The error bars represent 95% confidence intervals (CIs), the effects of eCO2 are significant when the 95% CIs do not overlap zero. The mean and 95% CIs exact values are on the right side. The asterisks indicate significant differences (∗P < 0.05; ∗∗P < 0.01; ∗∗∗P < 0.001). Numbers next to the y-axis indicate sample sizes
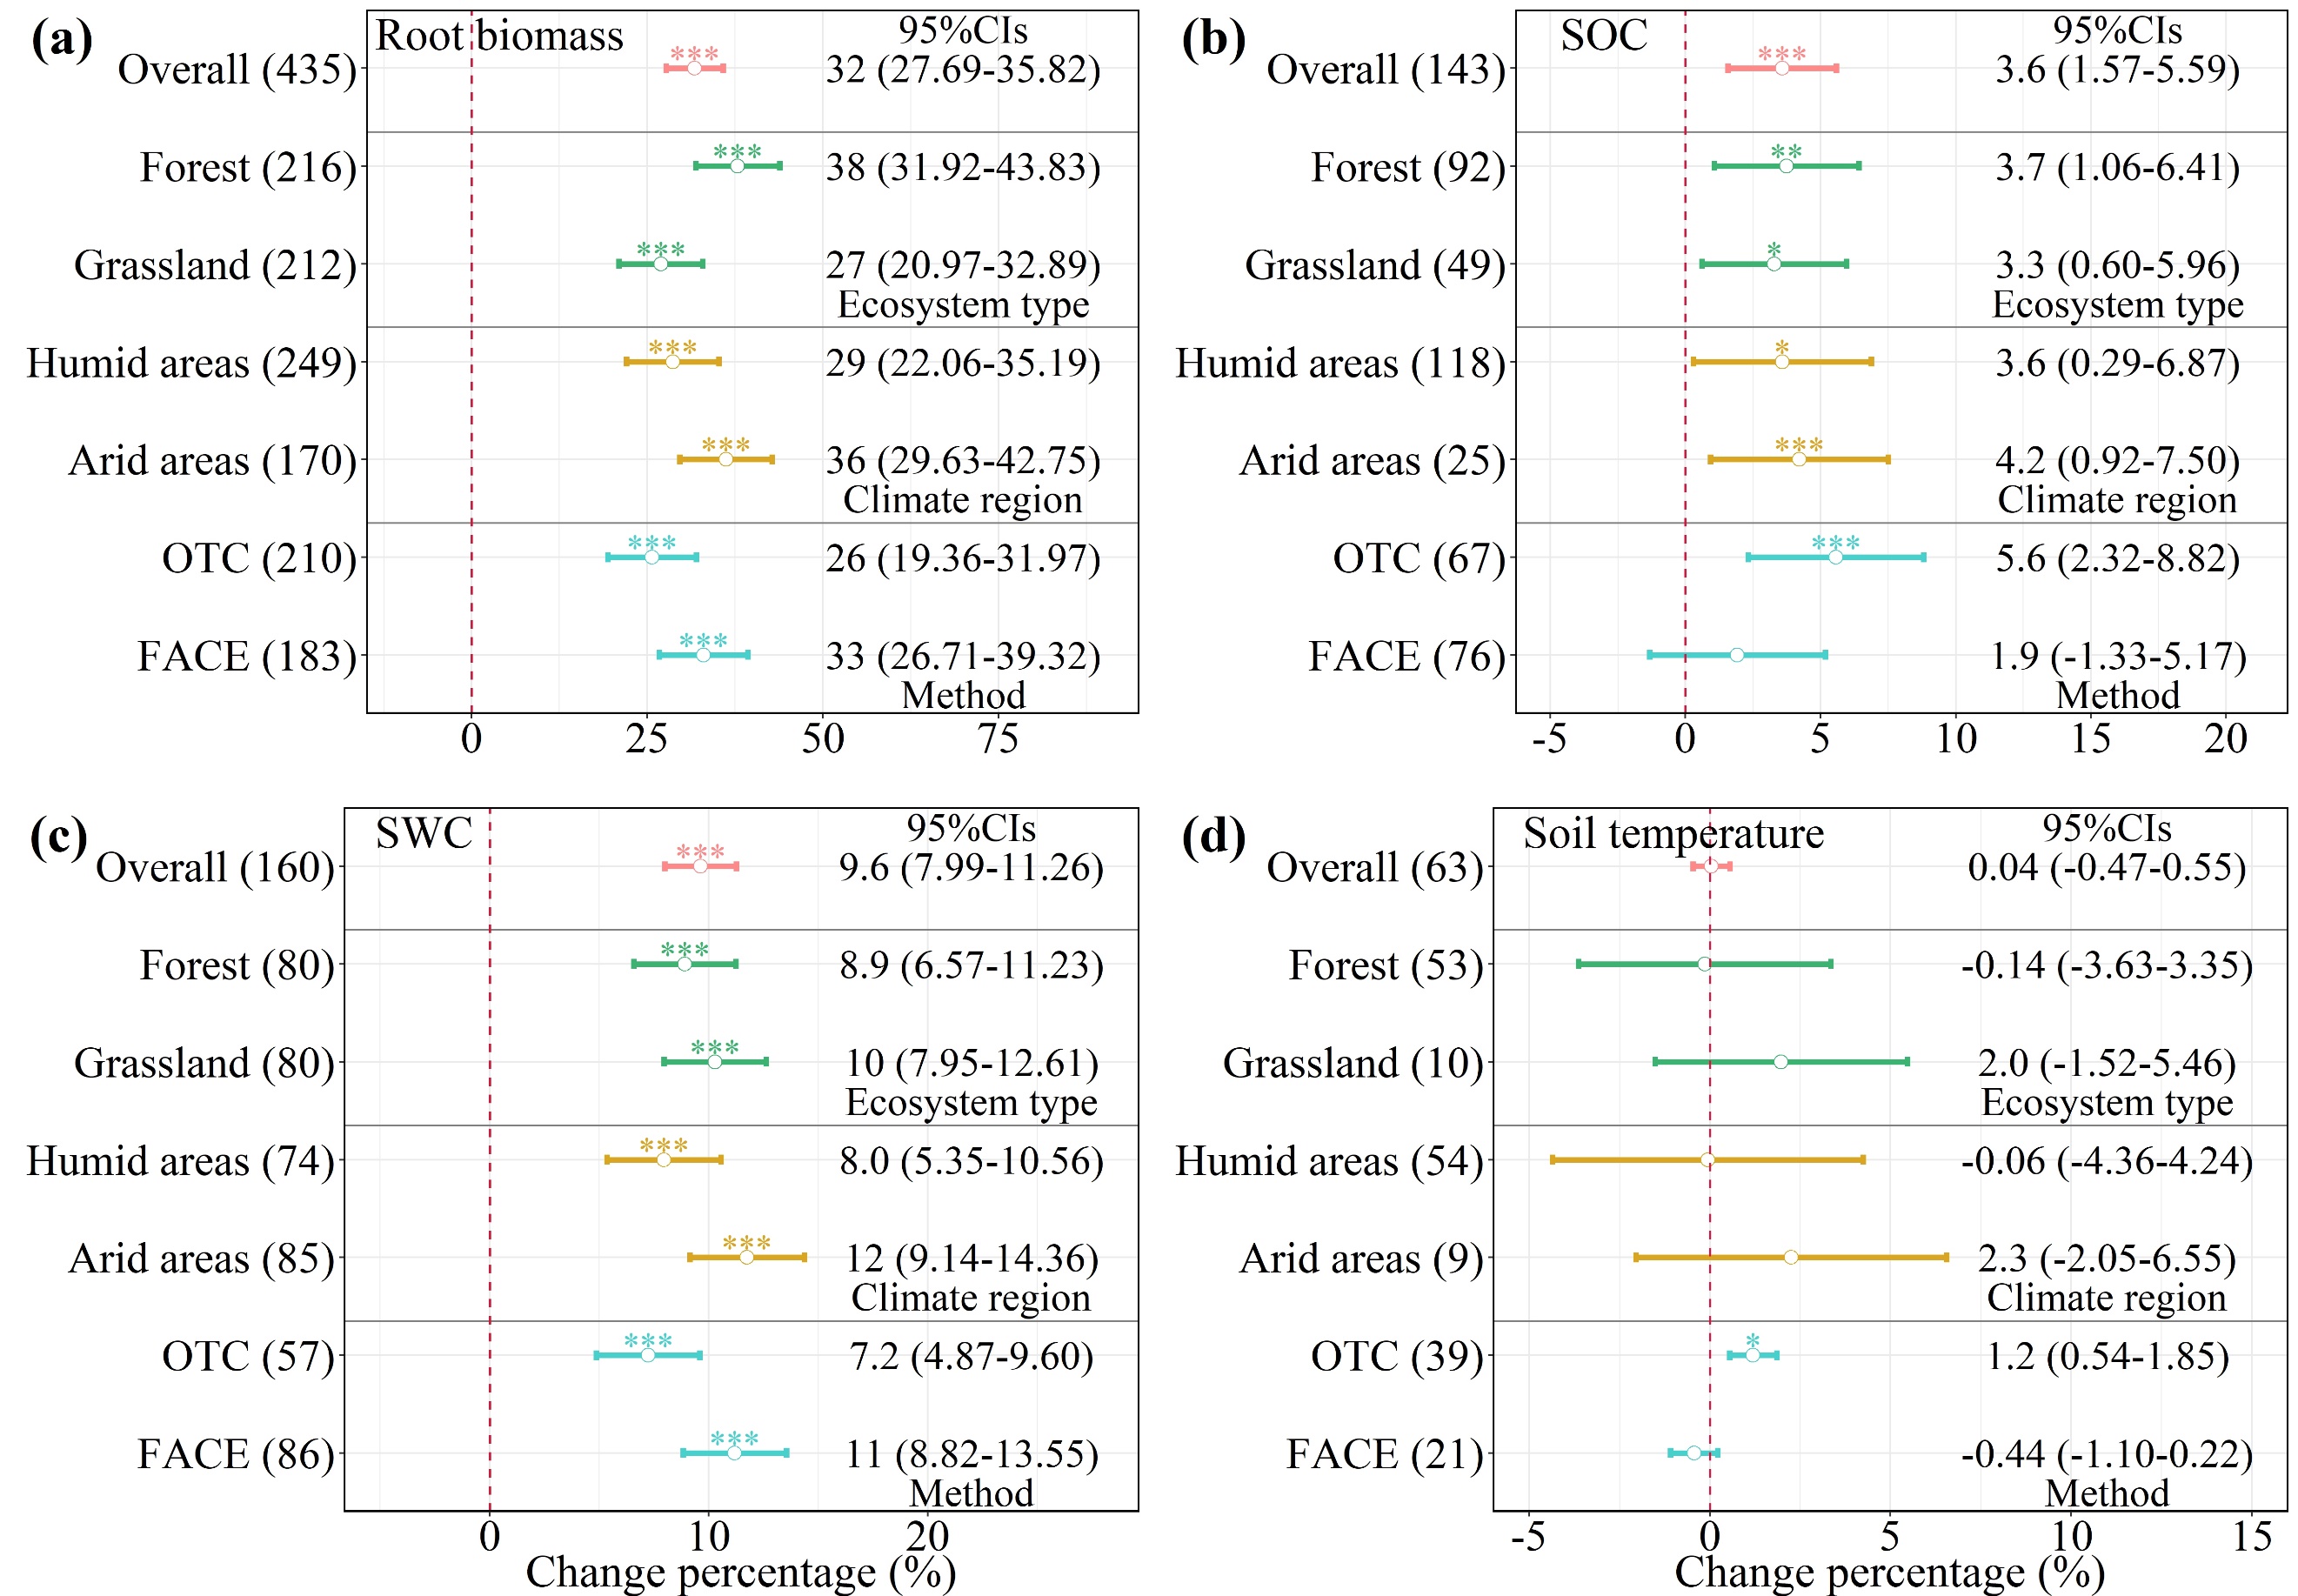
Fig. 4. The effect of eCO2 on root biomass (a), SOC (b), SWC (c), and soil temperature (d) across different ecosystem types, climate regions, and eCO2 methods. The error bars represent 95% confidence intervals (CIs), the effects of eCO2 are significant when the 95% CIs do not overlap zero. The mean and 95% CIs exact values are on the right side. The asterisks indicate significant differences (∗P < 0.05; ∗∗P < 0.01; ∗∗∗P < 0.001). Numbers next to the y-axis indicate sample sizes.
增强型回归树分析表明,干旱指数是影响Rs对eCO2反应的最重要因素,占总变异的19.88%,其次是土壤含水量(19.87%)、生态系统(18.99%)、平均降水(12.42%)、黏土含量(7.64%)和eCO2浓度(7.32%)。此外,分段结构方程模型显示,气候、土壤特性、生态系统和eCO2处理能够解释eCO2对Rs影响的70%的变异。生态系统总效应的协方差系数为0.652,大于土壤特性(0.474)和气候(0.283)。需要注意的是,eCO2并未直接影响Rs,而是通过影响土壤特性间接地影响Rs,尽管这种影响是显著微弱的(0.033)。有趣的是,SWC是影响Rs的最重要土壤性质因子。
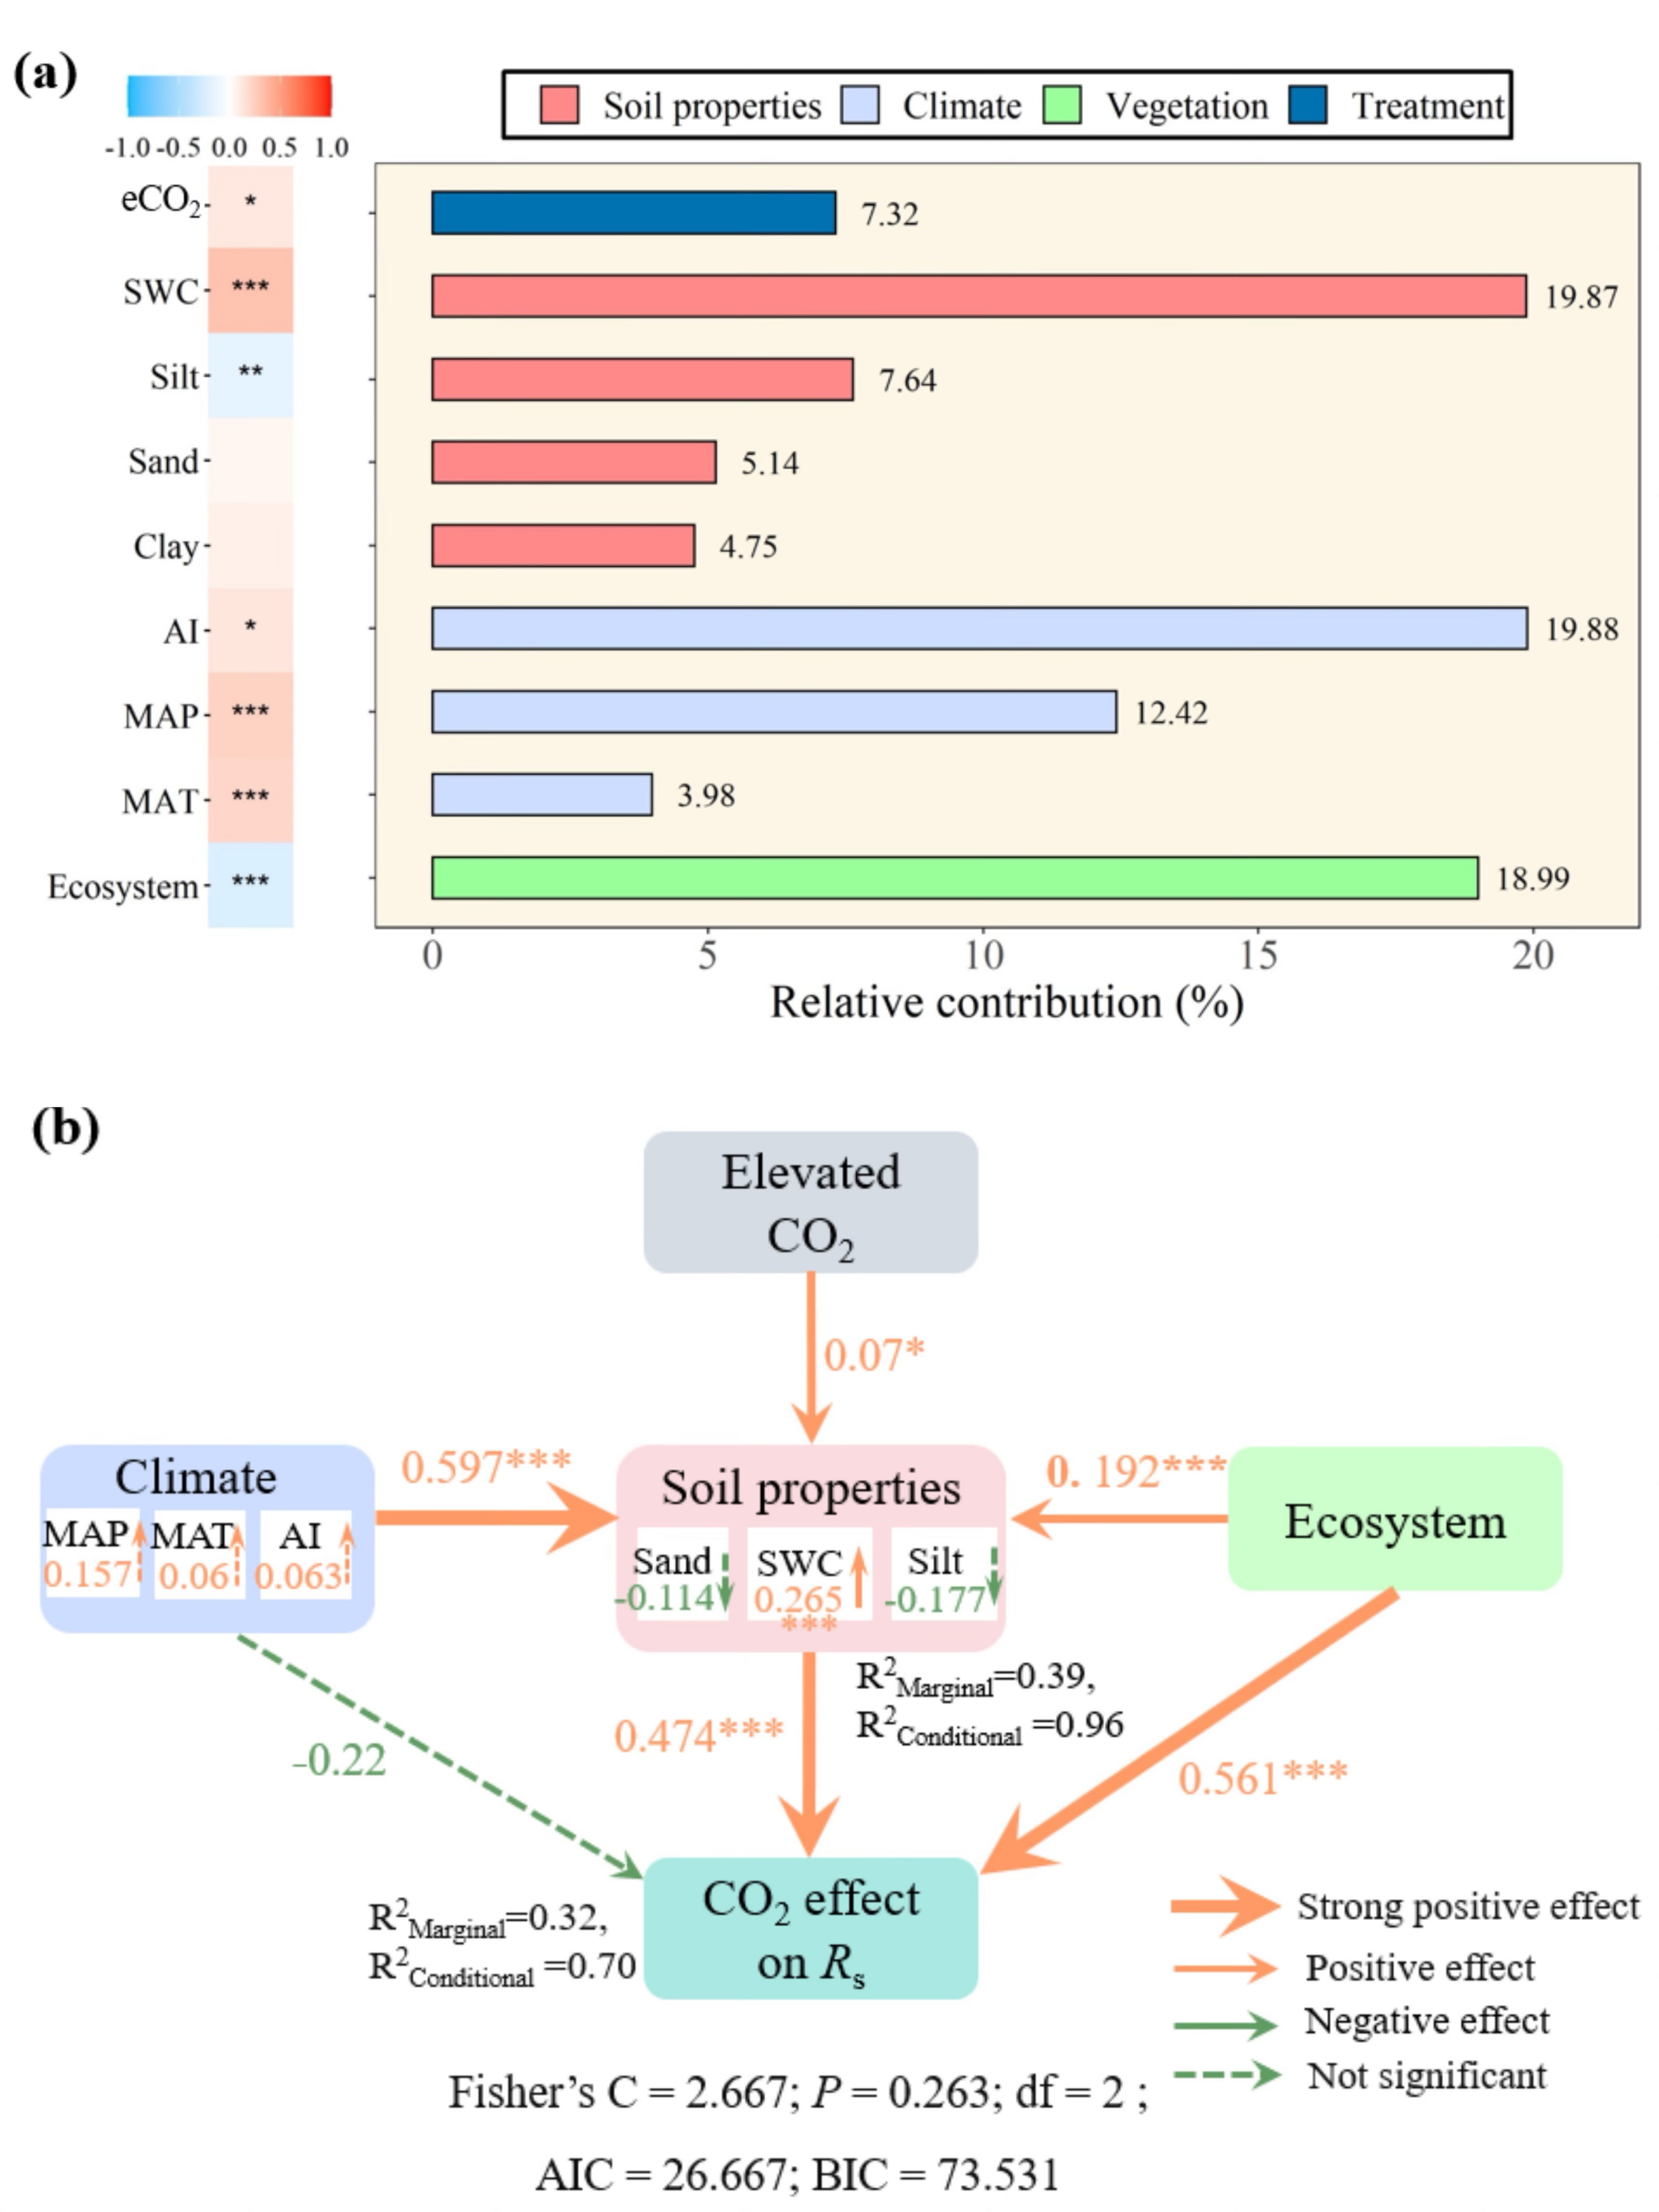
Fig. 5. The relative importance of controlling factors on Rs based on random forest analysis (a), and structural equation modeling between key factors and eCO2 effects on the Rs (Fisher's C = 2.667; P = 0.263; df = 2) (b). The orange and green arrows indicate significant positive and negative effects (P < 0.05), respectively, whereas dashed arrows indicate nonsignificant relationships. Values adjacent to arrows represent standardized path coefficients. The width of the arrows is proportional to the strength of path coefficients. R2 represents the proportion of variance explained. The asterisks indicate significant differences (∗P < 0.05; ∗∗P < 0.01; ∗∗∗P < 0.001).
混合效应元回归分析(Mixed-effect meta regressions)表明,就气候变量而言,Rs效应量与MAP和MAT之间存在显著的正相关关系。对于土壤性质,随着SWC的增加,eCO2对Rs的积极影响呈现先增加后降低的趋势。此外,Rs效应量与干旱指数呈正相关,这表明eCO2下Rs随湿度的增加而增加。
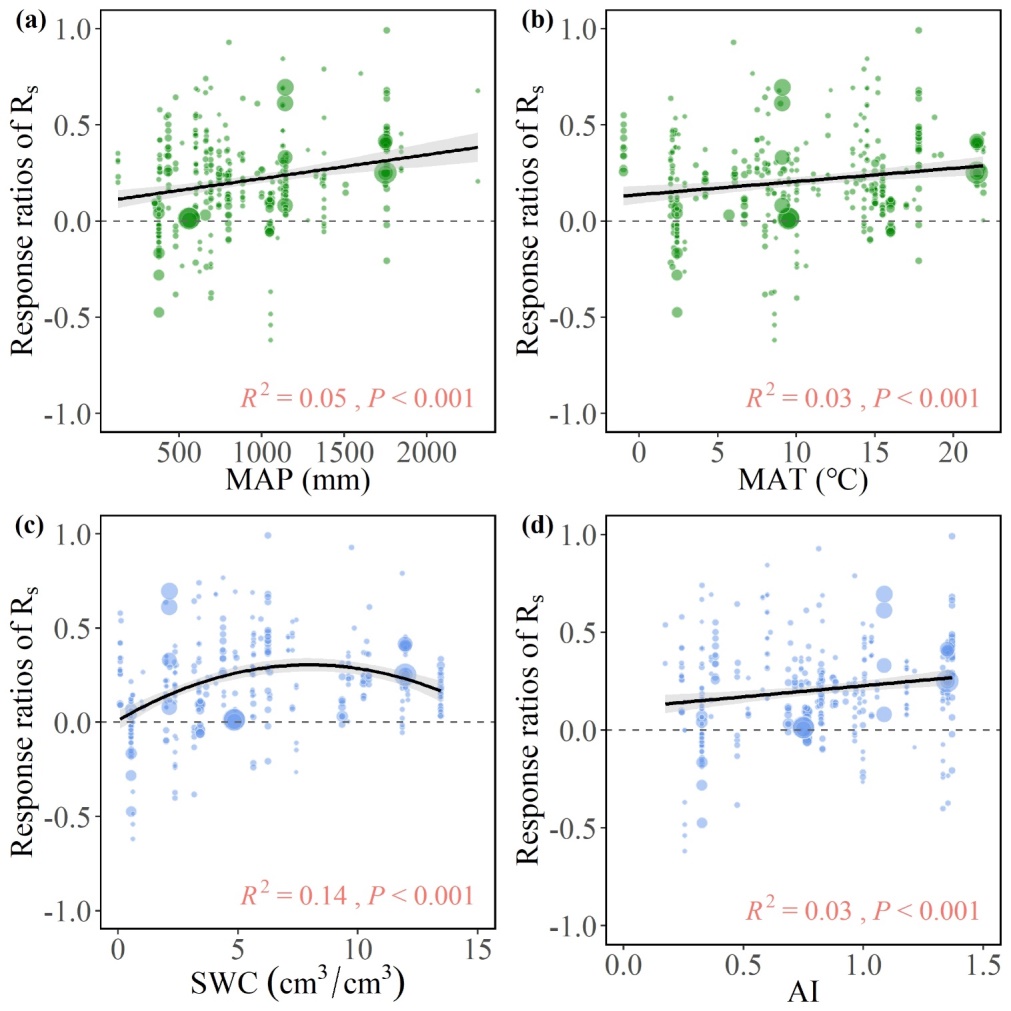
Fig. 6. The relationship between mean annual precipitation (MAP) (a), mean annual temperature (MAT) (b), soil water content (SWC) (c), aridity index (AI) (d) and Rs using mixed-effect meta regressions. The size of the bubble is proportionate to the weight of the effect size (lnRR) in the random-effects meta-regression. The gray area around the regression line represents the 95% confidence interval.
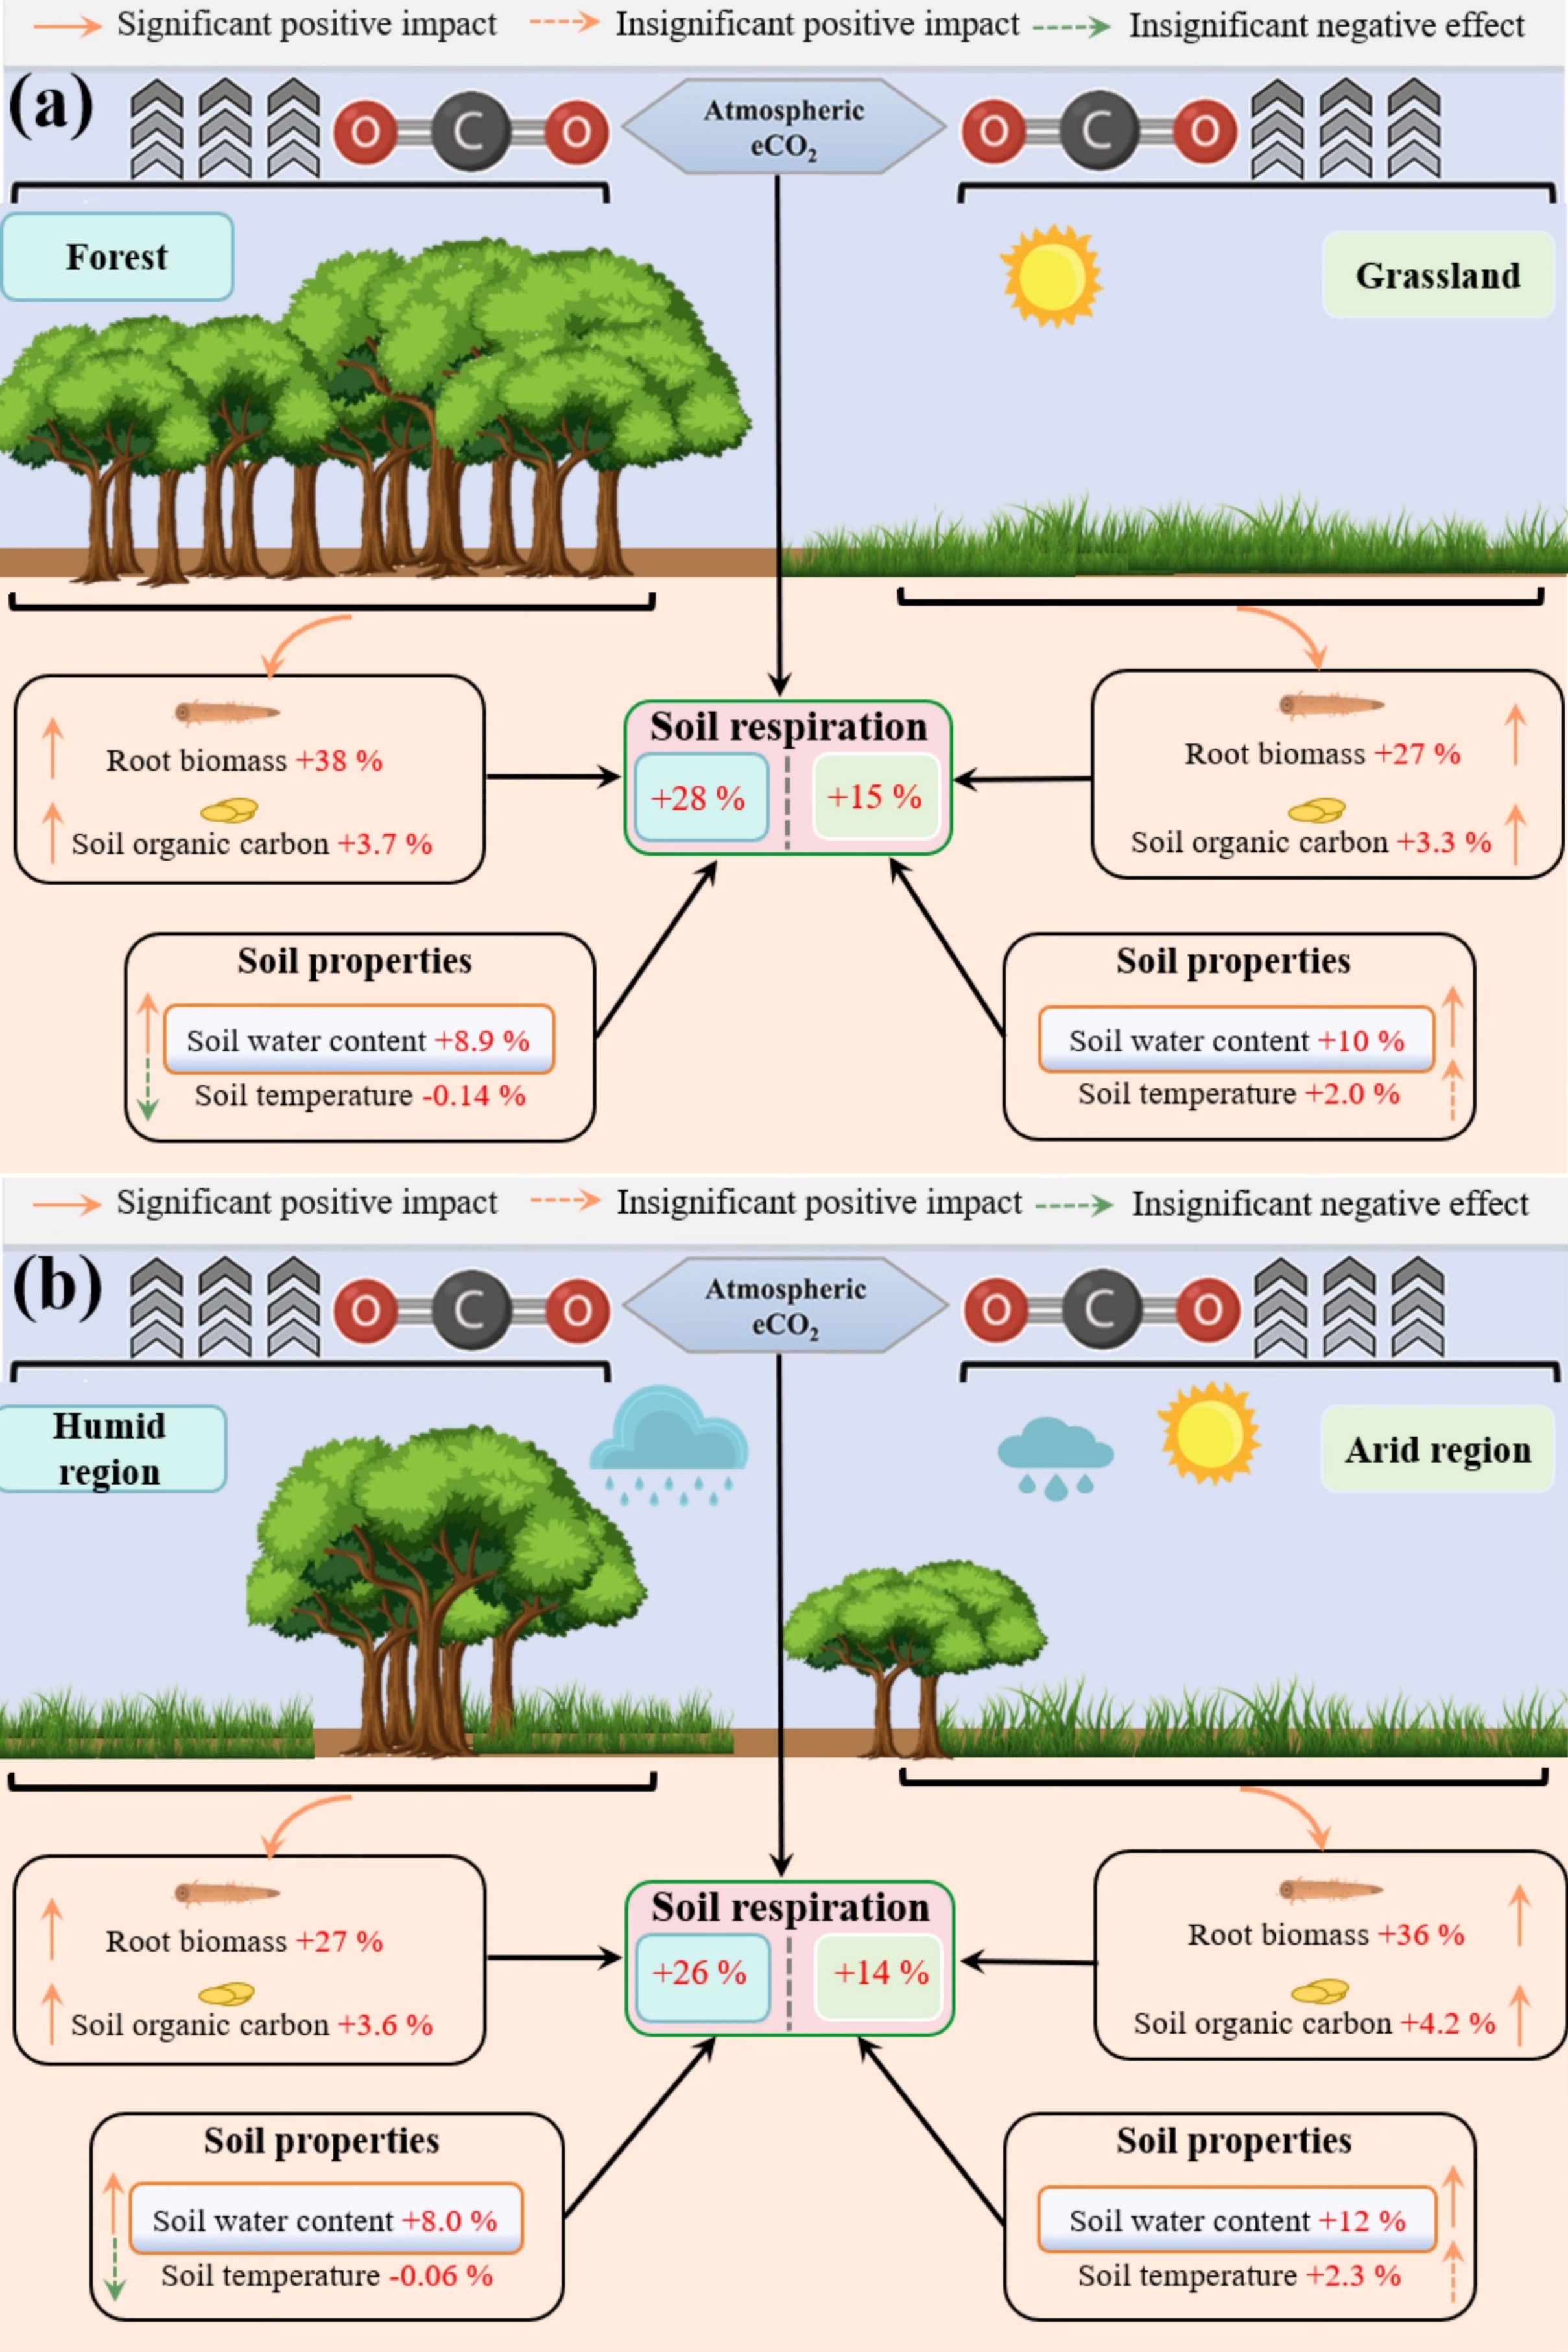
Fig. 7. Mechanism of responses of carbon budget to eCO2 across different biomes (a) and climate regions (b). The upward arrows indicate positive responses and the downward arrows indicate negative responses. The humid region was defined as AI > 0.65 and arid region was defined AI ≤ 0.65. The forests mainly include temperate seasonal forests, temperate forests, and boreal forests; the grasslands mainly include temperate grasslands and savannas.
小结与展望
综上所述,了解eCO2对Rs的影响对于准确预测未来全球变化情景下的碳动态至关重要。这项研究综合了207篇全球发表的eCO2实验文章中的1191组配对观测数据,量化了Rs及其相关因素对eCO2的响应。结果表明,eCO2处理通过增强根系生物量、土壤有机碳和土壤含水量显著提高了Rs。此外,eCO2对Rs的影响在不同生态系统类型和气候区域之间存在显著差异。eCO2促进了土壤碳输入,导致土壤CO2排放增加,尤其是在森林生态系统中。此外,CO2对Rs的影响受CO2暴露强度和持续时间的影响,Rs与eCO2持续时间呈凸形关系,这意味着随着时间的推移,CO2对Rs的积极影响会逐渐减弱。总体而言,这项研究拓展了我们对不同生态系统和气候区域中Rs对eCO2响应的理解,并为未来提高土壤碳循环模型的准确性以及制定有效的气候变化政策提供了科学依据。
【关闭】